Protecting and Preserving Natural capital is our commitment, and we achieve it through sourcing responsibly, managing emissions/discharges/wastes, and balanced use of natural resources.
Aditya Birla Textile lives by its vision of creating value through sustainable initiatives and contribute towards cleaner air, pure water, preservation of flora & fauna and enhancement of biodiversity across the sites we operate in. Every manufacturing unit works towards minimizing its environmental footprint and endeavours to be in harmony with the ecosystem.
use of natural capital gets strengthened and we strive to improve our environmental footprint continuously. Our policies for effective management of natural resources has been established and is supported by a list of standards and guidelines to mandate acceptable practices. We have articulated Biodiversity policy, Energy and Carbon policy, Environmental policy and Water Stewardship policy signed by the top management and circulated among all our employees. These policies enable us for proactive management of issues relating to energy, environment and climate action which forms a core component of our business strategy and drives the culture at all the manufacturing units of Aditya Birla textiles. We are also committed to reducing the environmental footprint of our operations and our products.
We also have a written Integrated management system (IMS) manual that ensures that all our operations comply with all national and international environmental laws and regulations. Our engineering team guides and ensures effective implementation of the IMS manual about biodiversity management, energy and carbon management, water management, solid and hazardous waste management, air quality management, noise management etc.
The Unit Heads of all the manufacturing facilities makes the specific effective implementation of the ABG standards. This includes procedures about energy and carbon management, water management, solid and hazardous waste management, air quality management, noise management etc.
The reports about environment management key indicators are reviewed by our top management every month to understand and support the mission.
OUR GHG FOOTPRINT
The textile manufacturing value chain is the source of the highest GHG emissions, but it also has the potential to reduce global GHG emissions significantly. We are conscious of the fact that energy is the most significant contributor to greenhouse gas (GHG) emissions, accounting for more than half the total emissions. We monitor our GHG emissions closely and aim to reduce across the value chain. We are conscientious of the roadmap we have planned and therefore undertaken several energy-saving initiatives to reduce GHG emissions. Our investment decisions on projects prioritize GHG emission reduction potential. We are investing in efficient technologies and renewable energy to effect GHG emission reduction.
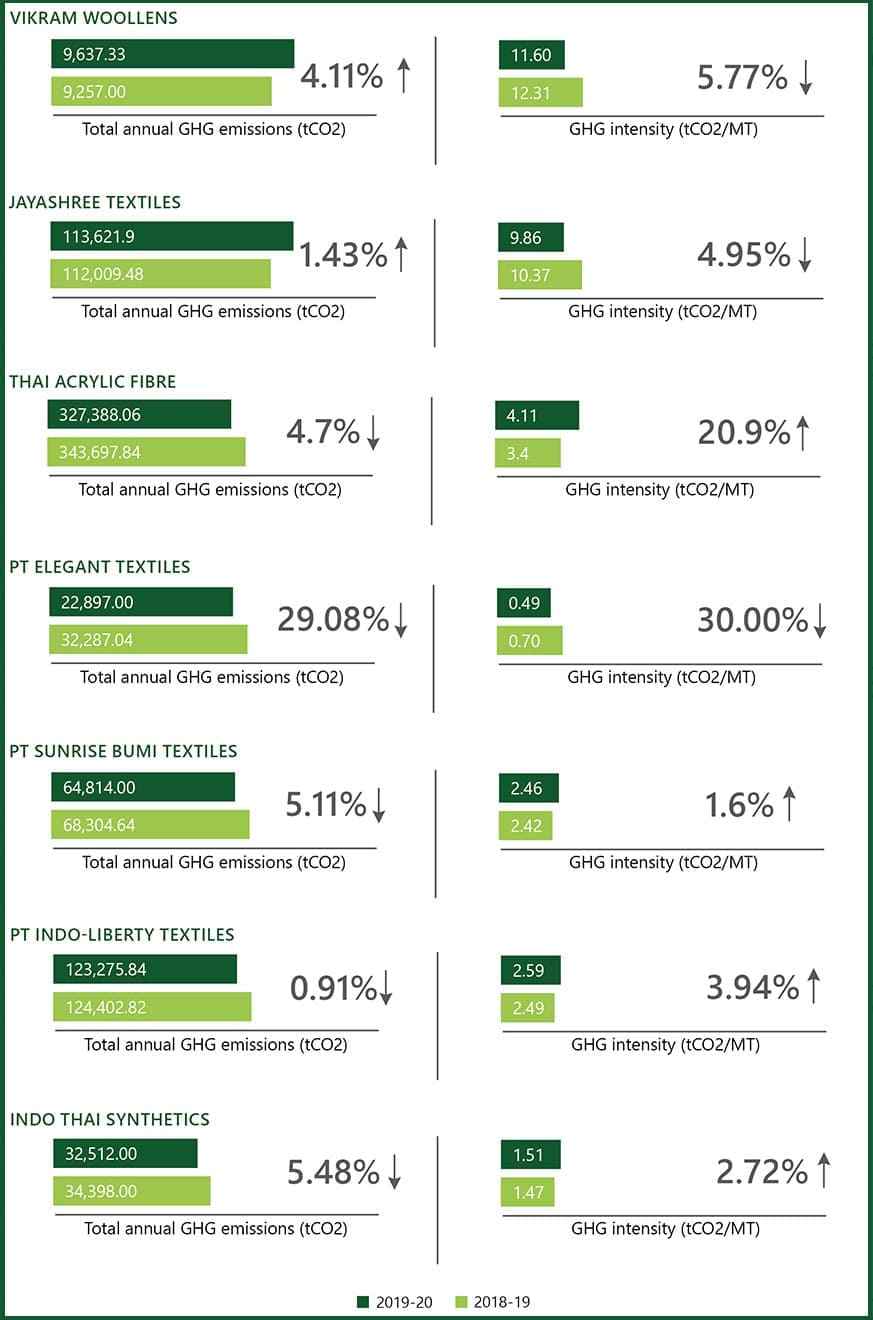
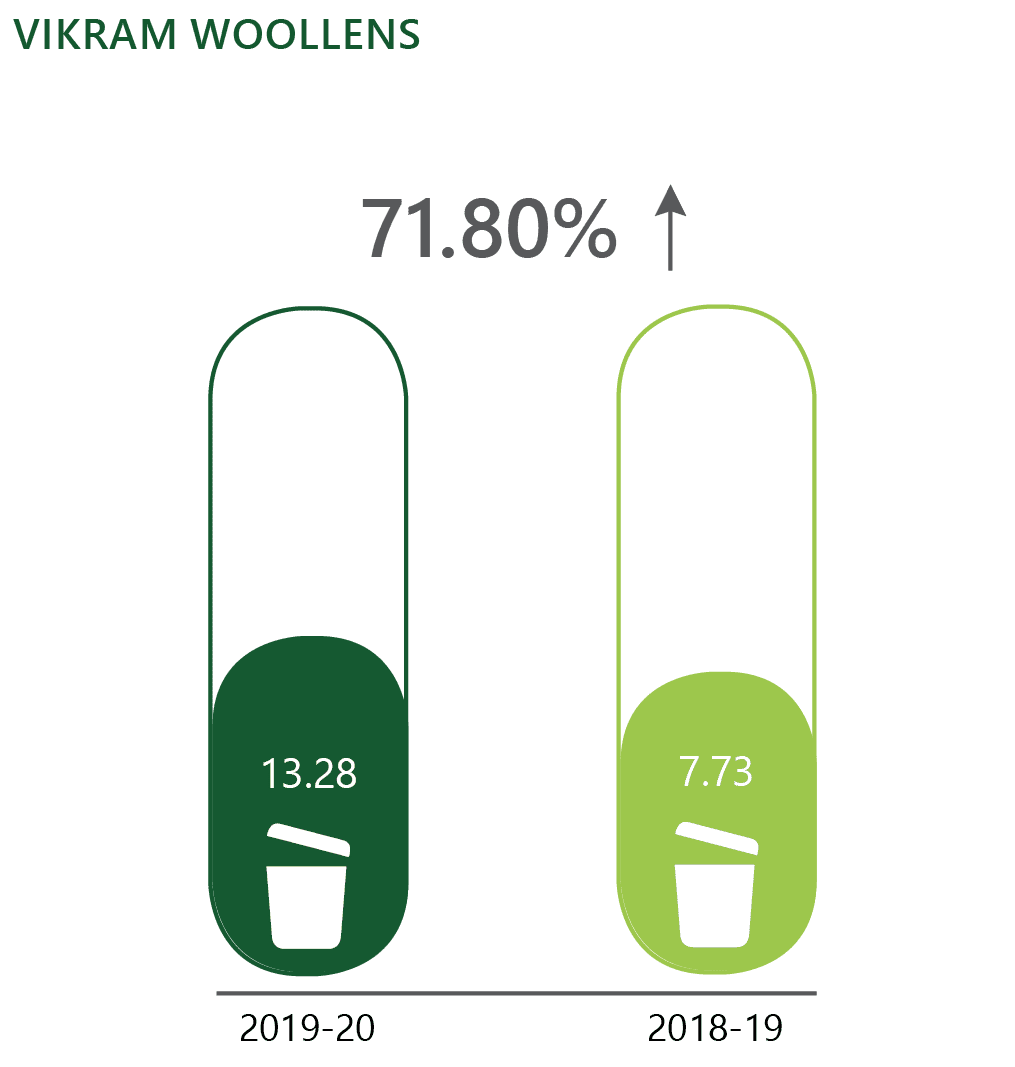
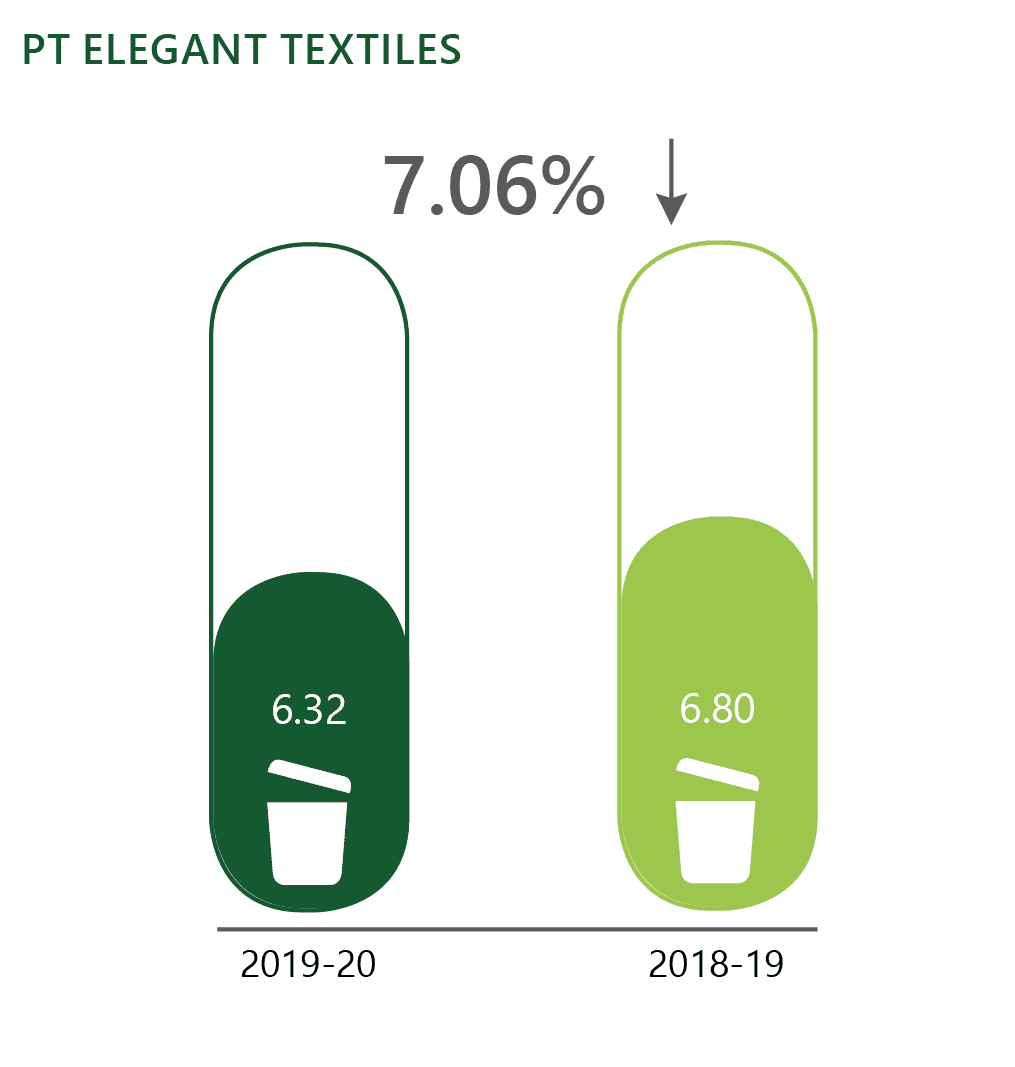
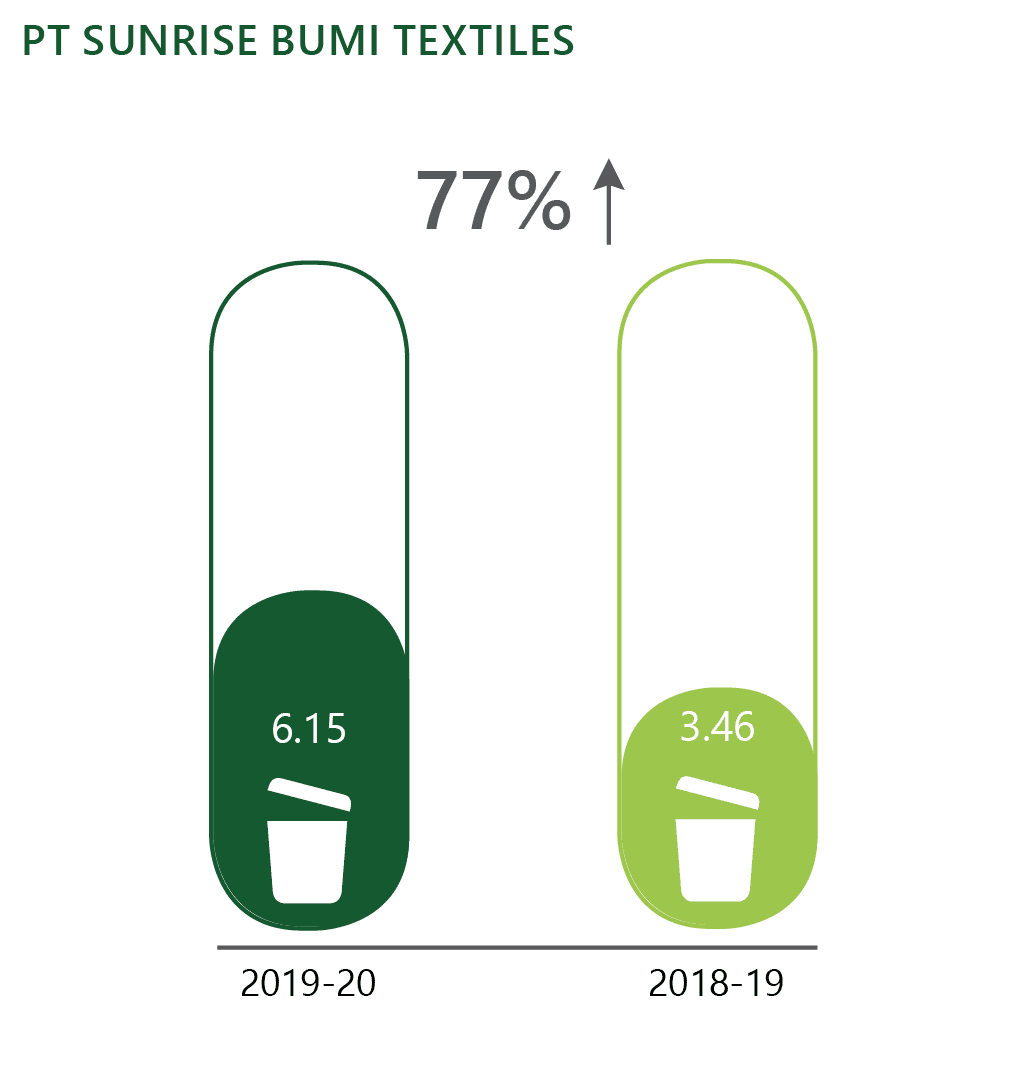
GHG EMISSION INTENSITY
The table below showcases our total GHG emission for FY 2018-19 and FY 2019-20 and its respective emission intensity for each entity

ENERGY
We focus on using energy resources responsibly as these are scarce and create a significant environmental footprint in extraction, processing and use. Our energy stewardship has two components viz., energy efficiency and renewable energy. Both these routes have the potential to reduce life cycle costs of energy and besides provide energy security and long-term cost assurance.
As a responsible organization, we believe in reducing the carbon footprint of our energy through efficient operations and the adoption of better technologies. To balance the growing energy demand, we invest our resources in creating safe and efficient infrastructure, equipment intended for economical use of energy and in the adoption of advanced technology. At all our manufacturing units, environmental and energy concerns are essential aspects in the planning of productions and investments.
Our well-planned roadmap guides us in improving our quality and modernizing technologies that guide us in improving our operational efficiency, the energy efficiency of the existing equipment and processes.
A dedicated team works relentlessly to identify and implement energy conservation initiatives, resource optimization and renewable energy projects at all our manufacturing sites. It also helps us reduce our dependence on fossil fuels.
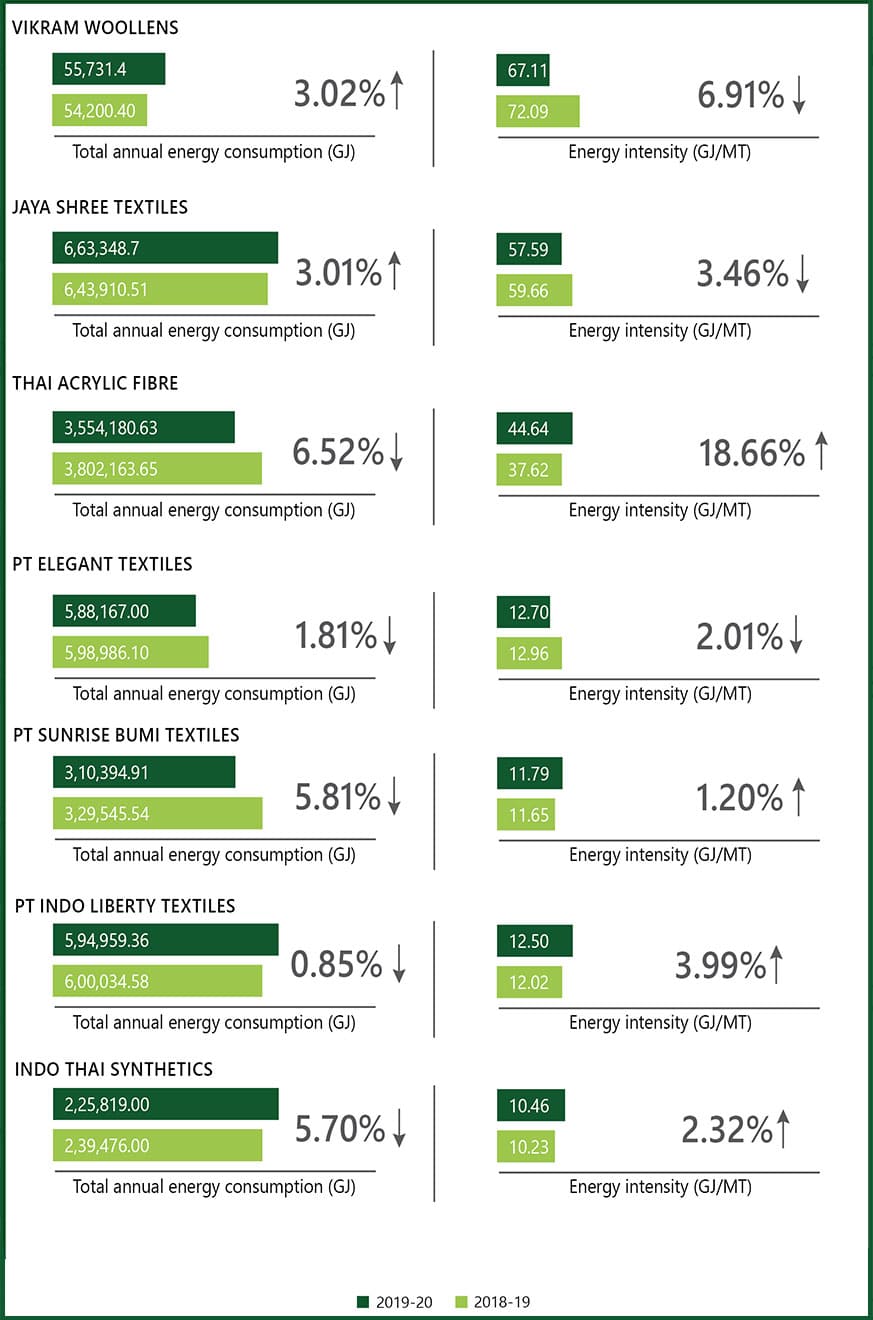
Annual Energy consumption (GRI 302) and Energy Intensity

ENERGY EFFICIENCY INITIATIVES AT PTE
| Initiatives | Activities | Outcome |
Installation of Inverters for Air Washers
|
Installed Inverters in air washers in the closed-loop. | A total of 840 kWh/ day Energy Saving |
Replacement of High-Efficiency chiller in M-2 Exp.
Capacity-600 TR
|
Replaced old High powerconsuming chiller capacity 600 TR in M-2Exp. | A total of 1,200 kWh/day saving |
Inverters for Suction Motors in Ring frame LR6
|
Installed inverters in suction motors of LR6 Ring frames in M-3 Exp | Energy savings: saving of 343 kWh / day |
Energy Efficient New Chiller of capacity 800 TR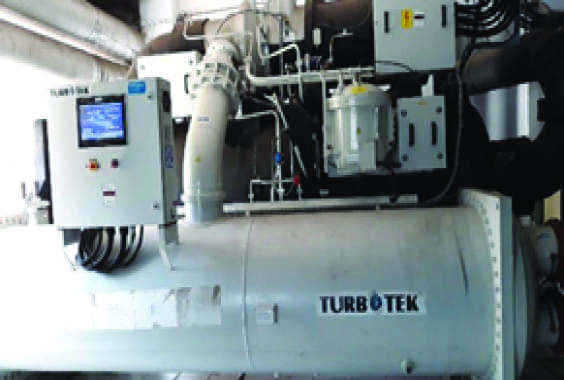
|
Replaced of old Inefficient Chiller at Mill 1 front side at PTS | Energy savings of 1.088 kWh / day |
Auto tube cleaning in chillers in Mill 1 & 2 for power
saving by maintaining the chiller condenser approach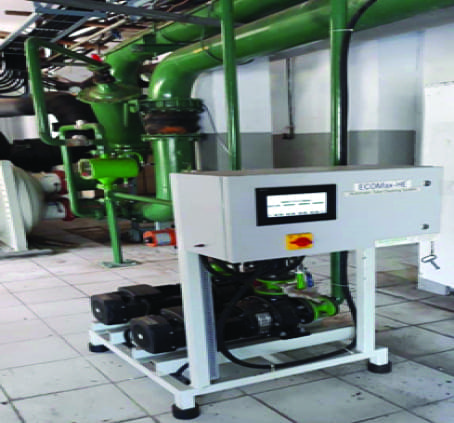
|
Energy-saving of
192 kWh/day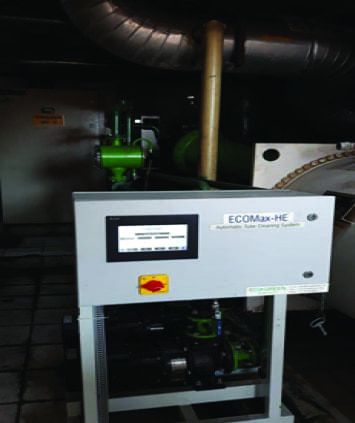
|
192 kWh/da |
Replacement of old/Rewound motors with Premium
Efficiency IE4 Motors in RY Ring Frame mcs. (M-1) -
48 mcs
|
Daily saving of 773 kWh/day |
ENERGY SAVING INITIATIVES AT ILT
Installation of Auto tube cleaning system condensor
side in Unit 3 & 4
|
Installation of Auto tube cleaning system condensor |
• Savings of 790
kWh/day • Saving of 22,815 USD |
| Installation of Auto tube cleaning system Evaporator side Mill-Exp | Installation of Auto tube cleaning system evaporator side mil-Exp |
• Saving of 294 kWh/
day • Saving of 8,491 USD |
| Replacement of tubes/fitting/valve in Winding section. | Arresting air leakages in Winding section/carding timely through monitoring & schedule replacement of tubes/ Fitting /valve etc. | Saving of 44,180 USD |
Replacement of LED tube lights (1000 nos)
|
Replacement of LED tube lights (1000 nos), Saving 652 kWh/day | • Total Saving up to 31st March 2020 is 28060 kWh resulting in saving of 2,245 USD |
| Modification in Regulated Pressure in COP sorter in Link Coner Machines to reduce the CFM from 3.5 CFM to 1 CFM at Winding section | Using Regulated Pressure in COP sorter in Link Coner Machines to reduce the CFM from 3.5 CFM to 1CFM, already trial taken on one Machine, Balance 94 machines to be modified |
• Energy Savings of
652 kWh/day • Saving of 7,928 USD |
Adoption of Renewable Energy
We promote the development and utilization of renewable energy across all the units with the goal to, improve energy mix structure, ensure energy security, protect the environment and contribute to sustainable development. At PTE (OS), we source more than 85% of our energy requirement from renewable energy sources
Table 2 Share of renewable energy %
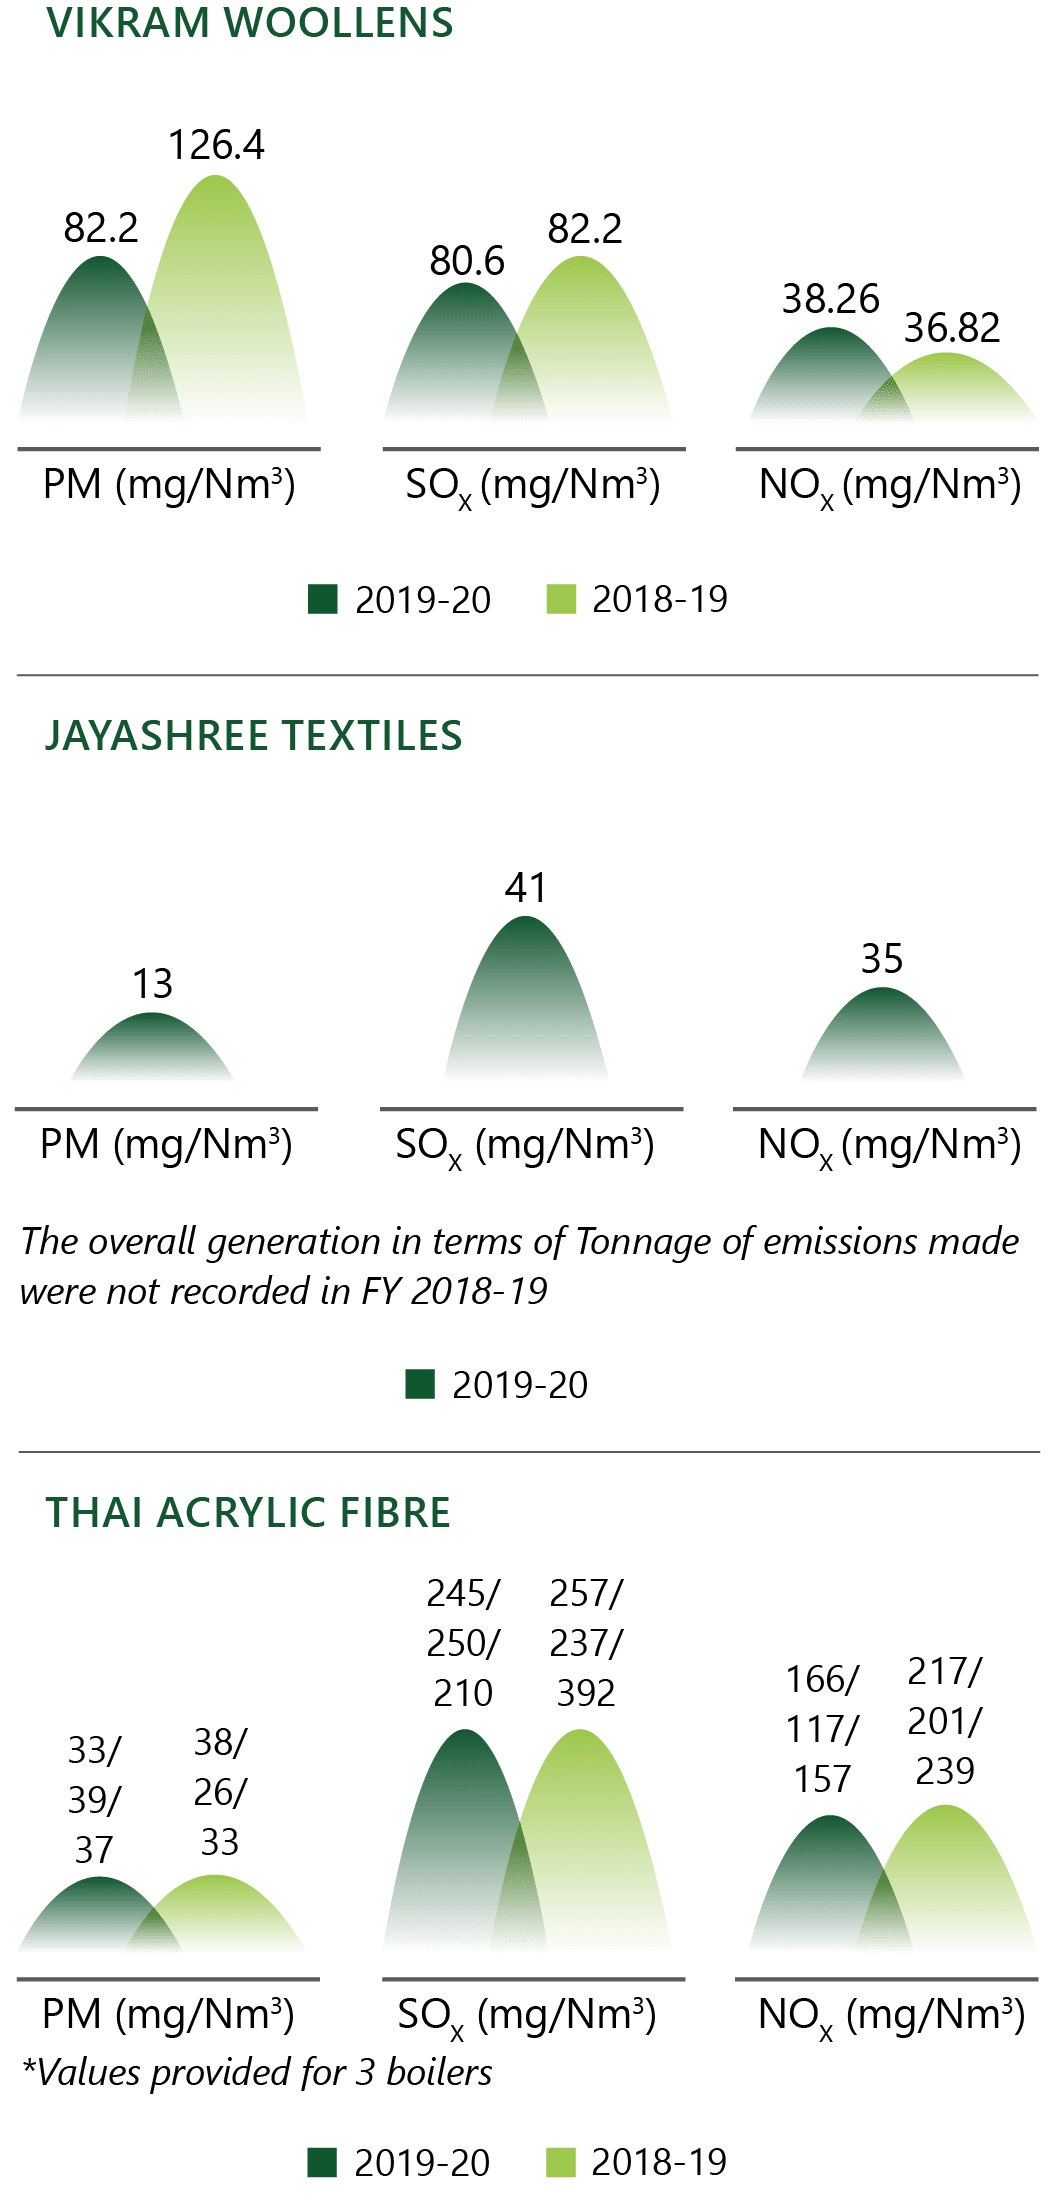
In Oversees Spinning, the emissions were reported as zero as there were no direct source of SOX and NOX emissions.
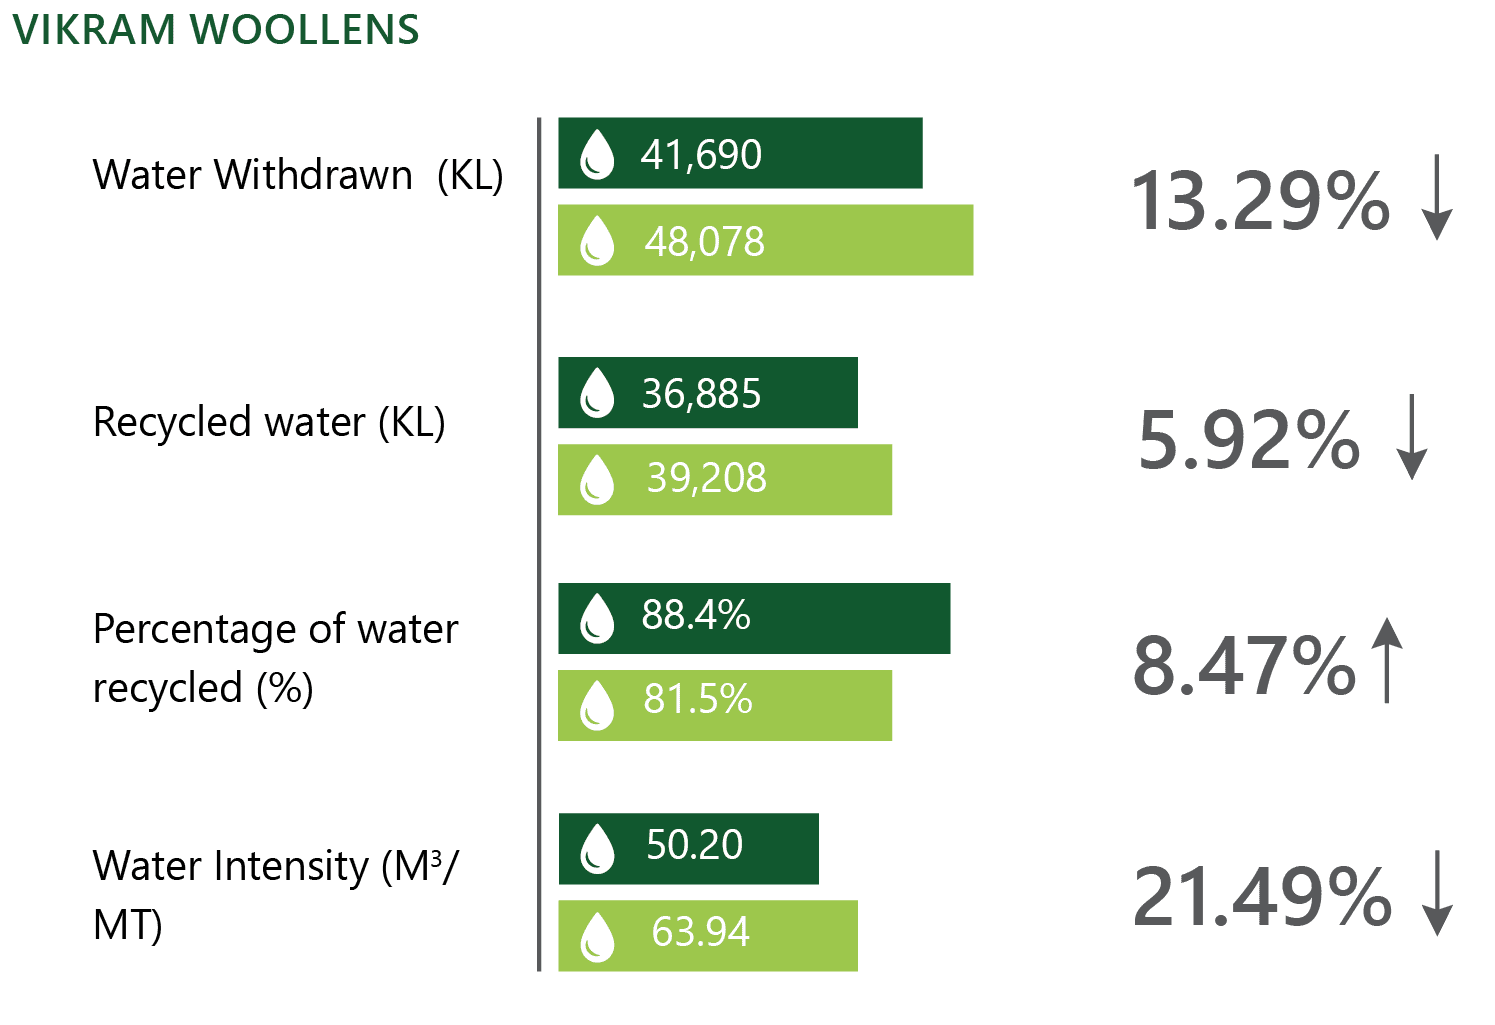
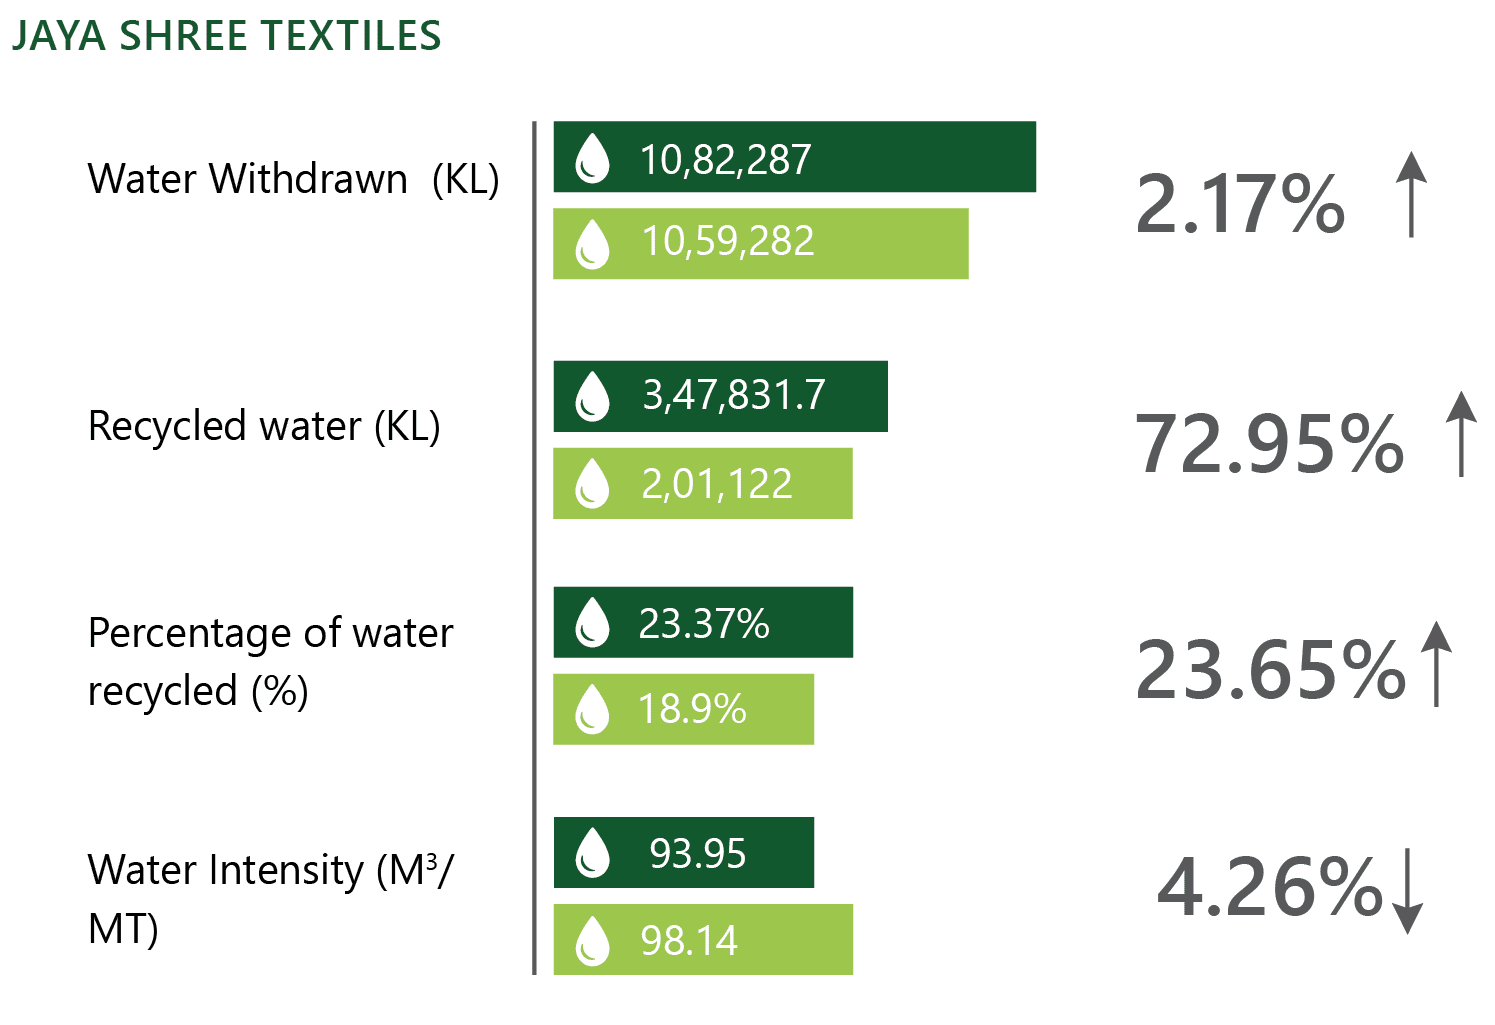
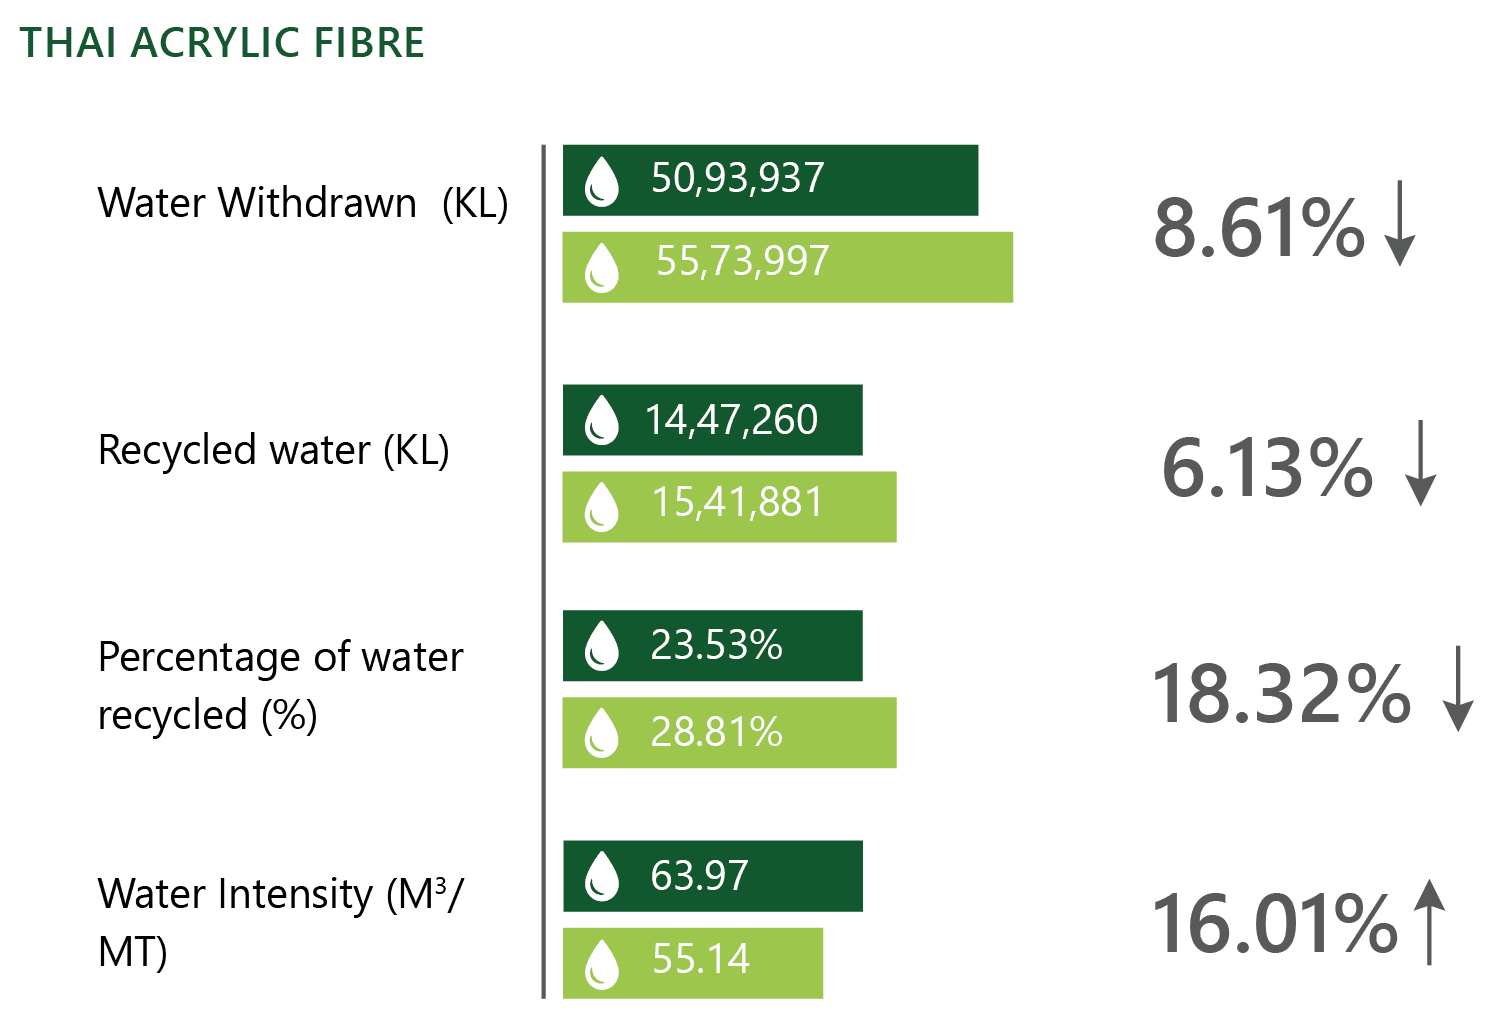
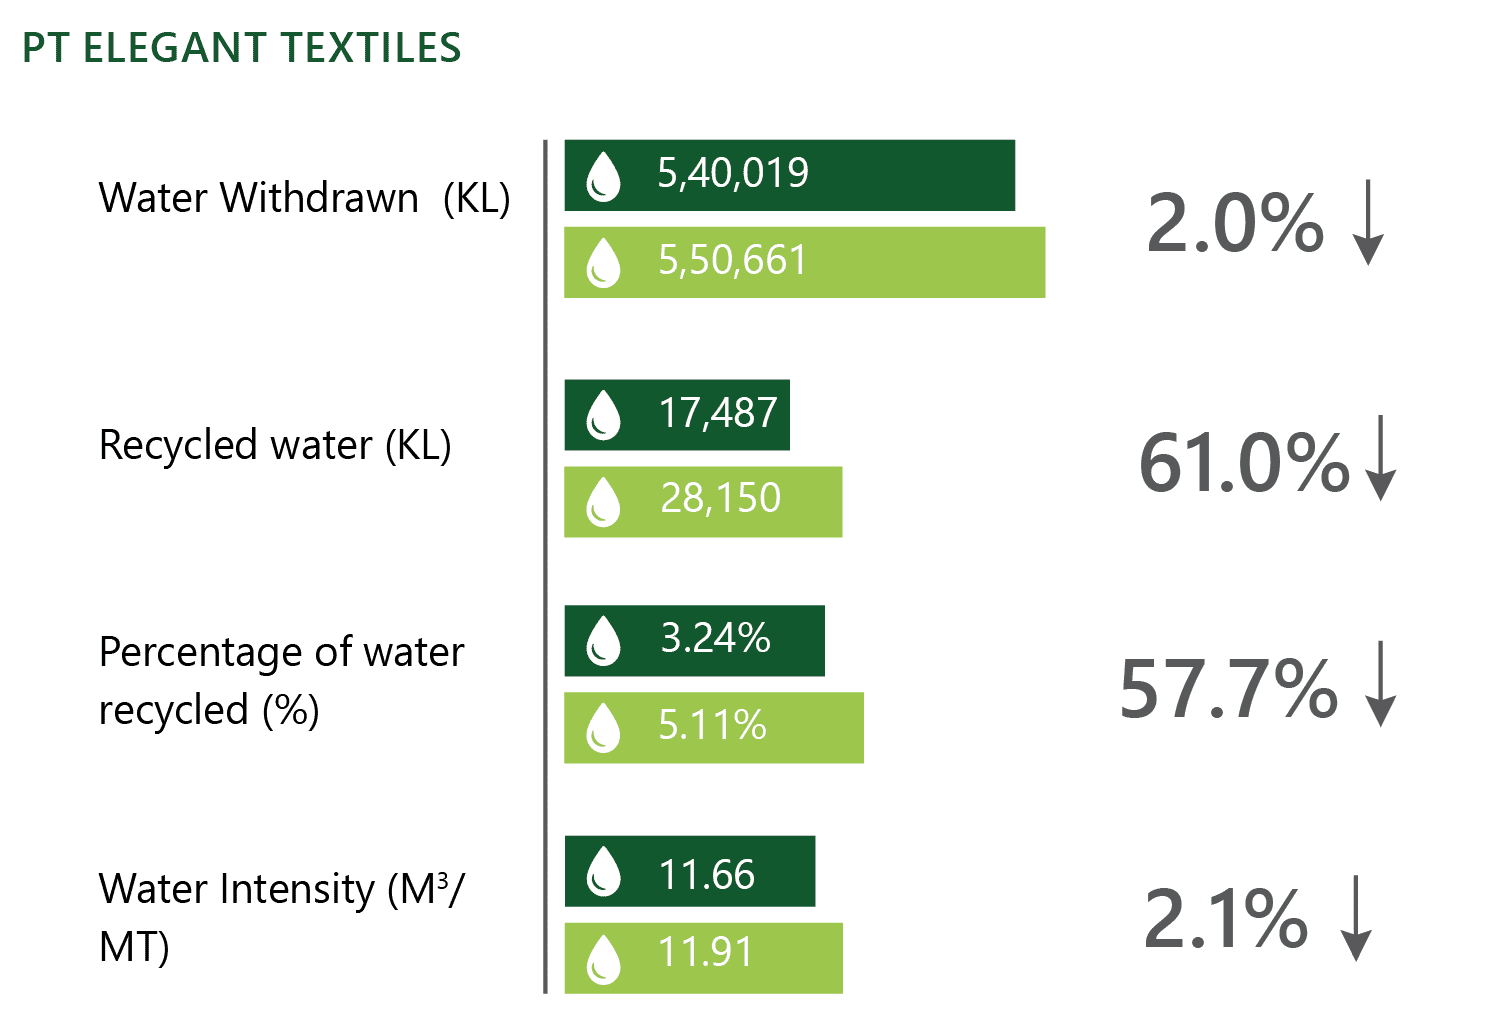
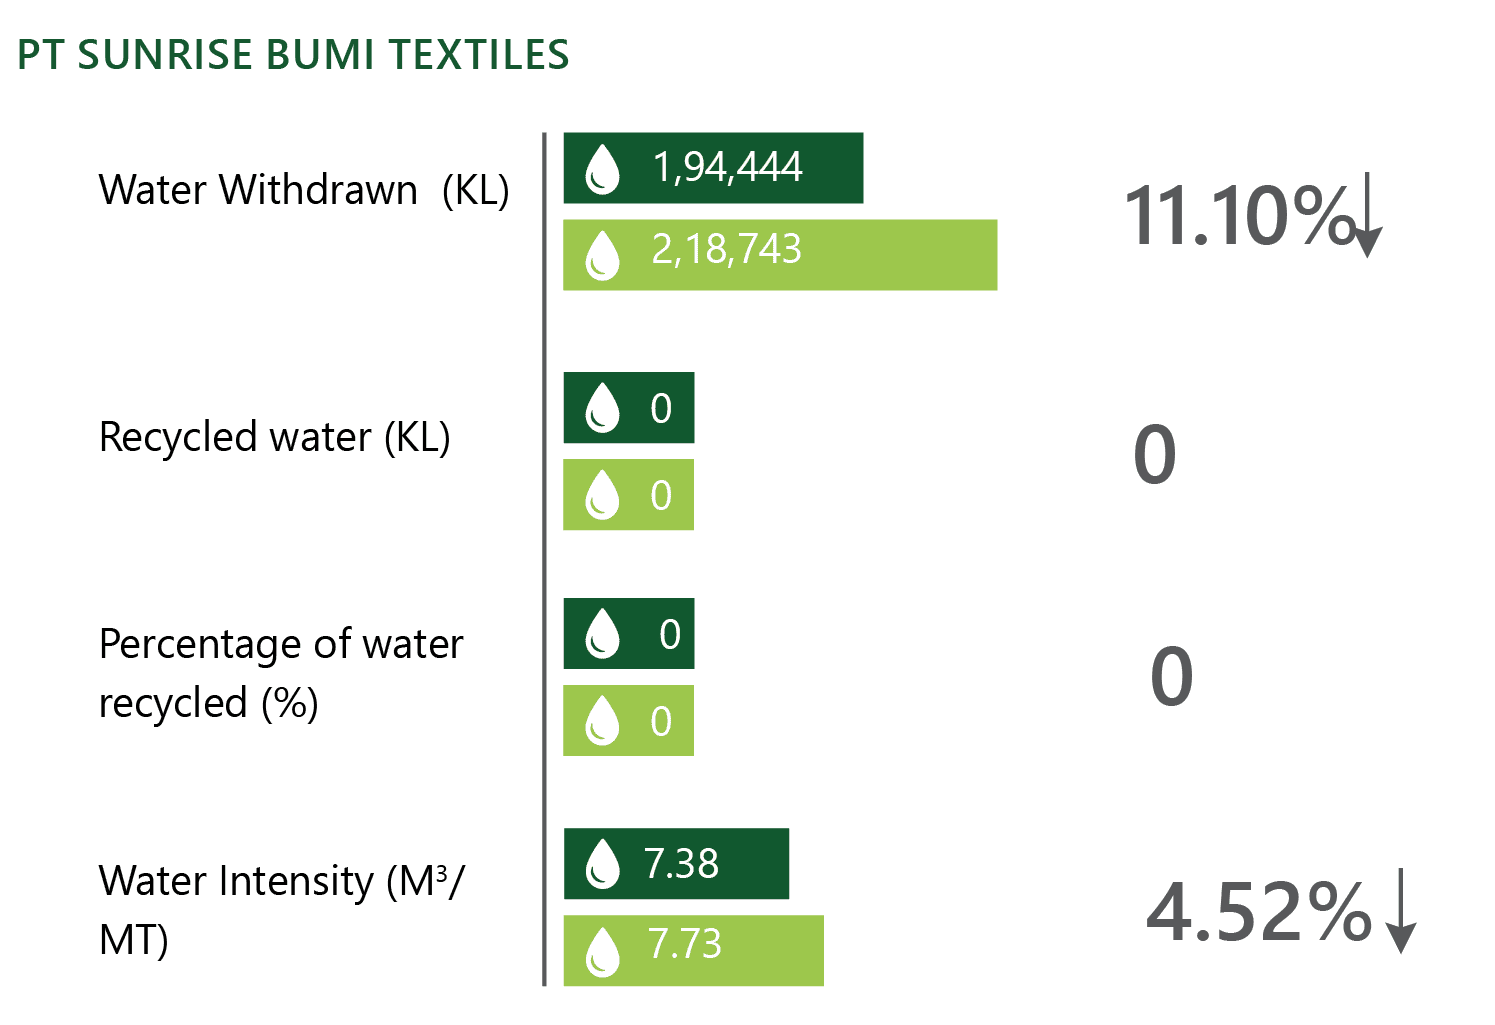
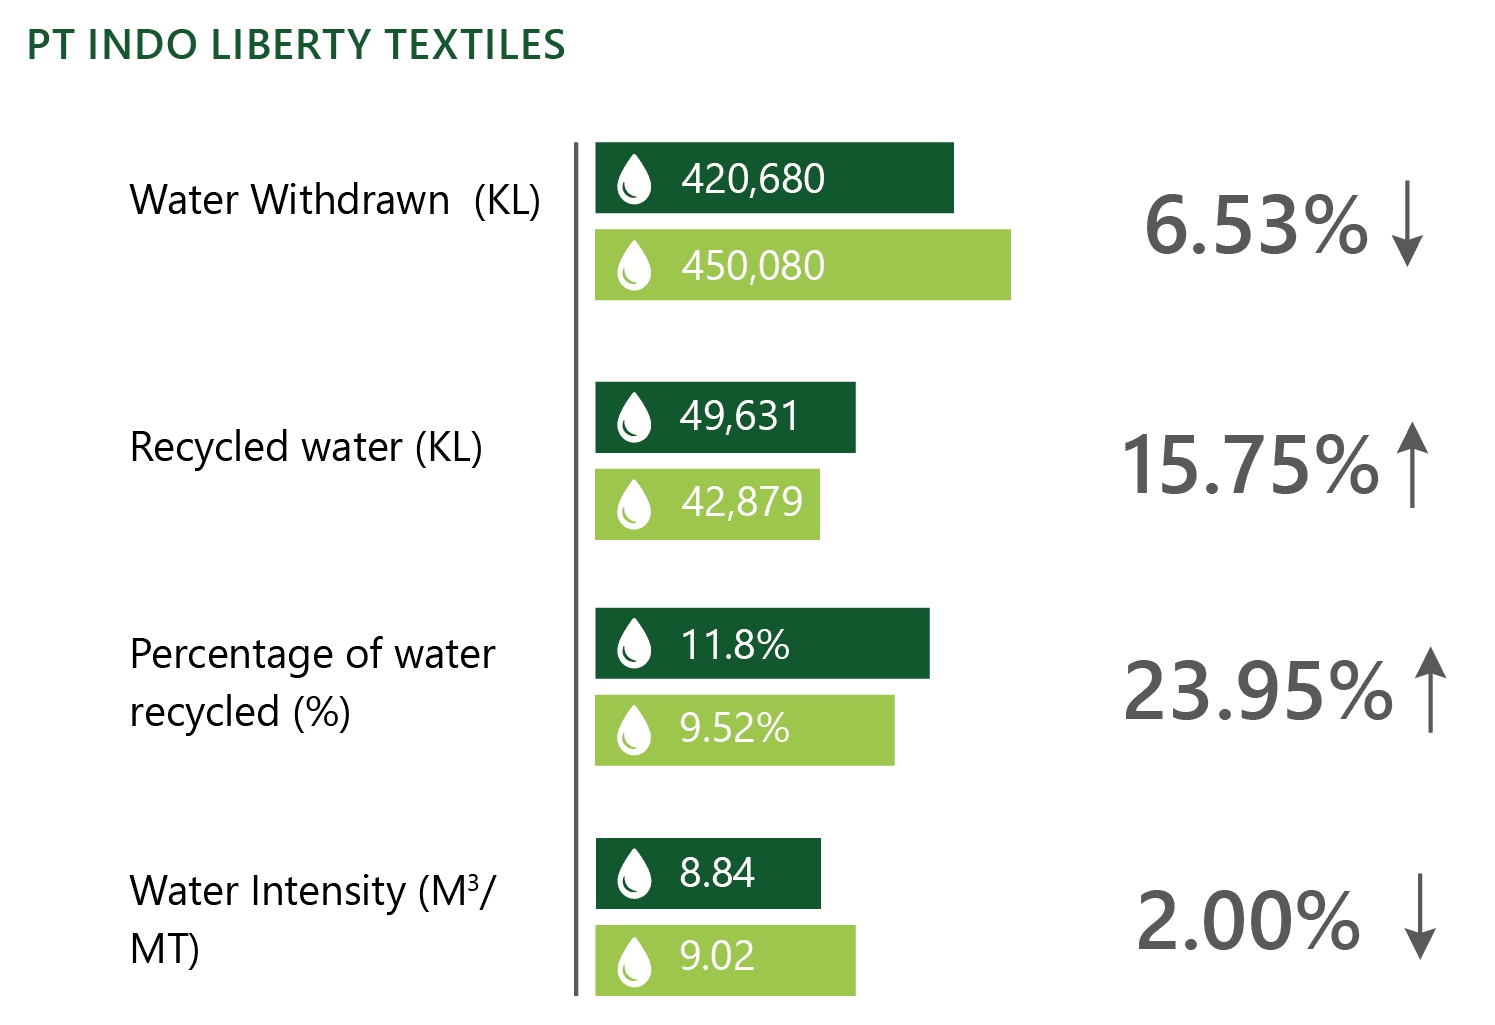
As a group, we believe water is a crucial resource and needs to be used responsibly with equitable sharing by the end-users, respecting the demands for domestic and agricultural uses. We recognize that good quality water has strong sustainability and ecosystem service value. Protecting and conserving water resources through excellent water management practices and governance systems are a priority for the Group and is integral to our commitment towards water stewardship. We focus on reducing water use, recycle-reuse wherever possible and harness water harvesting and water recharge opportunities.
We measure our water consumption, set targets, monitor, and optimize our water resources. We also assess risks, business cases and explore solutions for water risks within our manufacturing locations and proactively work toward mitigating the risks. Our performance is reviewed quarterly.
Reduction of Cooling Tower Blow Down Water at PTE
| Initiatives | Activities | Outcome |
| A Step towards Zero Discharge | During the FY 2019-20, we installed online conductivity monitoring & auto blow Down system for controlling conductivity & COC (Silica in CT / Silica in make-up water) of cooling tower water, which were earlier being checked manually weekly and blowdown valve was being adjusted. | Due to this activity, there was a reduction of CT Blow Down water by 31%. After installing at all 05 Mills – 45 -50 m3 /day water saving was achieved in blowdown which resulted in a decrease of freshwater consumption. |
Avoiding wastage of Rainwater at PTE
| Reduction in freshwater Intake from other sources by using rainwater harvesting. |
• We placed the water tank to
collect rainwater at roof of Mill-1.
• Automatically operating pump
installed for pumping harvested
rain water to primary water tank • All Piping & fittings used in the system made by PVC material to avoid corrosion & enhance life. |
• Reduction in water Intake
due to Water Harvesting. • Depending upon the rainfall We can save 25-50 M3 per day reduction of alternate source of water Intake |
Fixing the leakages in the pipelines at PTE
|
We used HDPE /PVC Pipes &
Fitting for water wherever there
were leakages • Underground corroded Pipelines replaced with overhead position to reduce hidden water leakage losses. |
• Check on water consumption not leading to use in production |
Installation rain water harvesting (phase-1) 300 m3 at ILT
|
• We placed a water tank to
collect rainwater at the roof of
the canteen • Automatically operating pump installed for pumping harvested rain water to primary water tank. |
• Reduction in water intake
due to water harvesting. • Depending upon the rainfall we are able to save 30 m³/ day reductions of alternate sources of water intake. |
|
| Recycled of water in water treatment plant - phase 1 |
Phase 1 April-19 Phase 2 December-19 |
Saving 50 m³/day reduction
of alternate source of water
intake. • Saving 100 m³/da |
| Replacement of old and corroded hydrant lines |
Jan-19 Phase-1 Dec-19 Phase-2 |
Chemical and dyes are an integral part of the textile value chain. Some of the processes involve intensive use of chemicals during its manufacturing process. Due to the hazardous nature of some of these chemicals used, adverse impacts are possible in the work environment, water bodies receiving effluents and end-users due to residual chemicals. At Aditya Birla Textiles, we aim to deliver healthy products to our consumers with minimized environmental footprint during its production. Our chemical management forms an essential element during product design, safe operations, safe effluents disposal, & no residue in the product for use. We strategize our management of chemicals to achieve a reduction in toxicity.
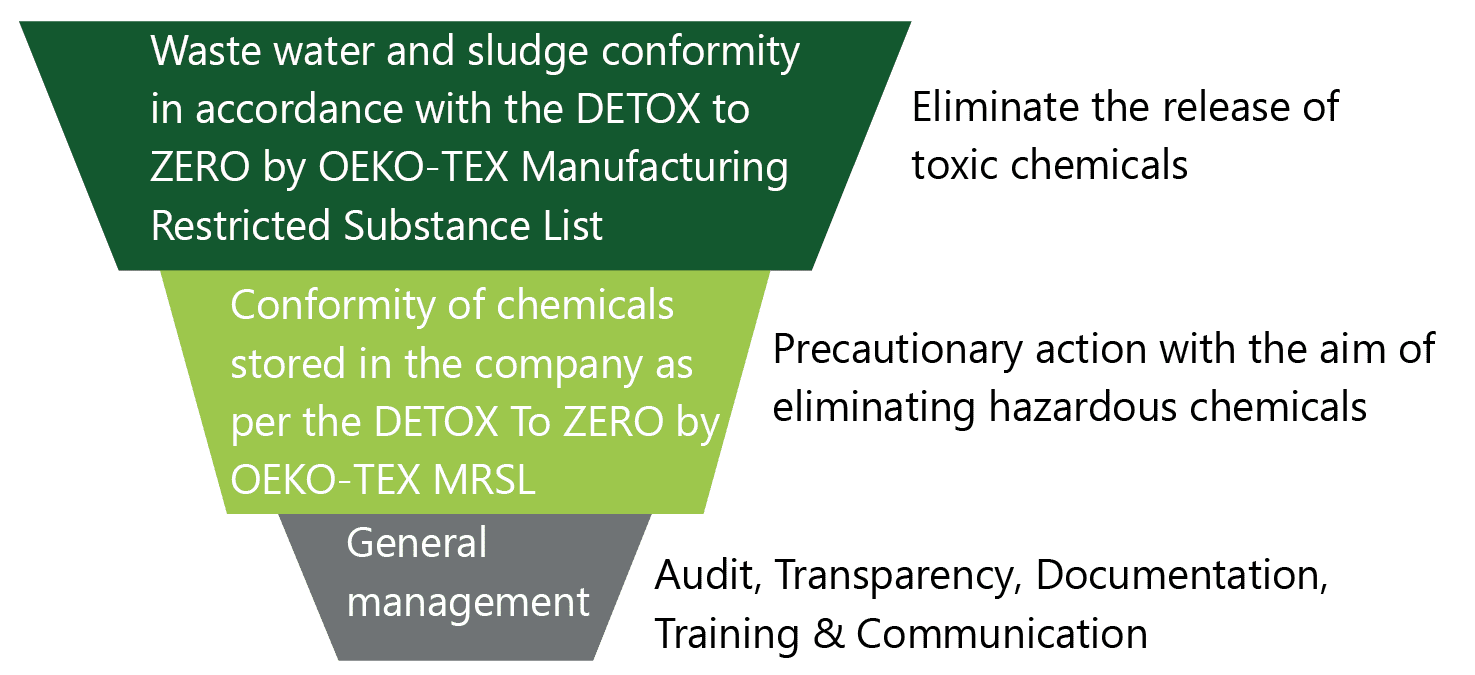
To address these challenges, we adopted Manufacturing Restricted Substances List (MRSL) of Zero Discharge of Hazardous Chemicals program as a mechanism to address and reduce the use of hazardous chemicals at the beginning of the manufacturing and production process, as opposed to at the end. We manage chemicals through our IMS, following ISO standards and REACH requirements. Any known/identified toxic, harmful and bioaccumulative chemicals and substances are avoided. We regularly train and update our employees on effective chemical management. We continuously conduct an assessment of chemical inventory and chemical management procedures at all the units and measure our compliance with international chemical legislation.
We evaluate the chemicals suppliers’ compliance concerning binding certificates and as per law. A scorecard for every dyestuff and chemical used within our units has been developed and assessed against the chemical supplier and rated chemicals for compliance with the above requirements.
During the FY 2019-20, we conducted Zero Toxicity Action Plan, in which we assigned responsibility to all the units, to recreate process flow where chemicals are used and prepare its impact. We conducted training of all the employees, on Chemical related document management, Preparations of chemical safety norms, transportation and hazard tracking log and reassured ourselves on our chemical management for compliance. We conducted stage-wise inventory mapping for chemicals. We also assessed our suppliers on their uses of toxic materials. During the plan or activity, projects have been identified for cost savings in chemicals. We also did an external assessment of the chemical management system.
Zero Toxicity Plan
The textile industry’s primary concern is the quantity of effluent generated and the high chemical load it contains. For the zero toxicity plan to be successful for us, we assess, audit and report on these parameters:
We also comply with product health and regulatory safety requirements in almost all countries of our exports and showcase our global good practice of product stewardship. During the reporting year, there were no significant Spillage in our operations.
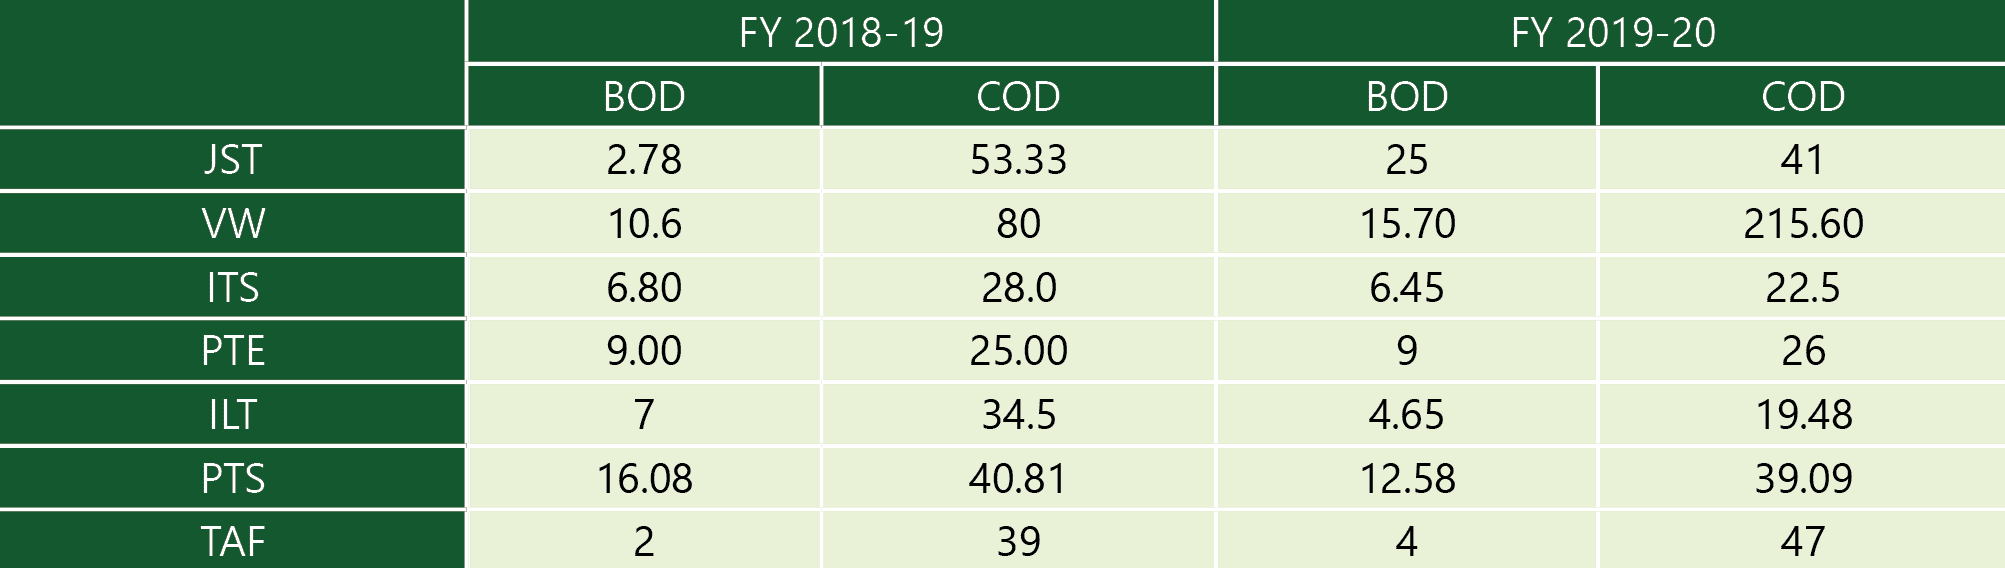
The textile industry’s primary concern is the quantity of effluent generated and the high chemical load it contains. Maintaining the quality of effluents is an essential aspect of chemical management. The level of BOD/COD monitors our diligent use of chemicals in our effluents.
Quality of discharged effluent (mg/L)
We strive to improve our material use efficiency. We adhere to our waste management policy and provide a structured approach to waste collection, handling, storage and disposal. Segregation of waste on the criteria of hazardous and non-hazardous, Recyclable and Non-Recyclable is practiced at our sites. We ensure proper disposal of waste with authorized waste handlers. Also, we set waste reduction targets at our budget conference.
QUANTITY OF HAZARDOUS WASTE (IN TONS)
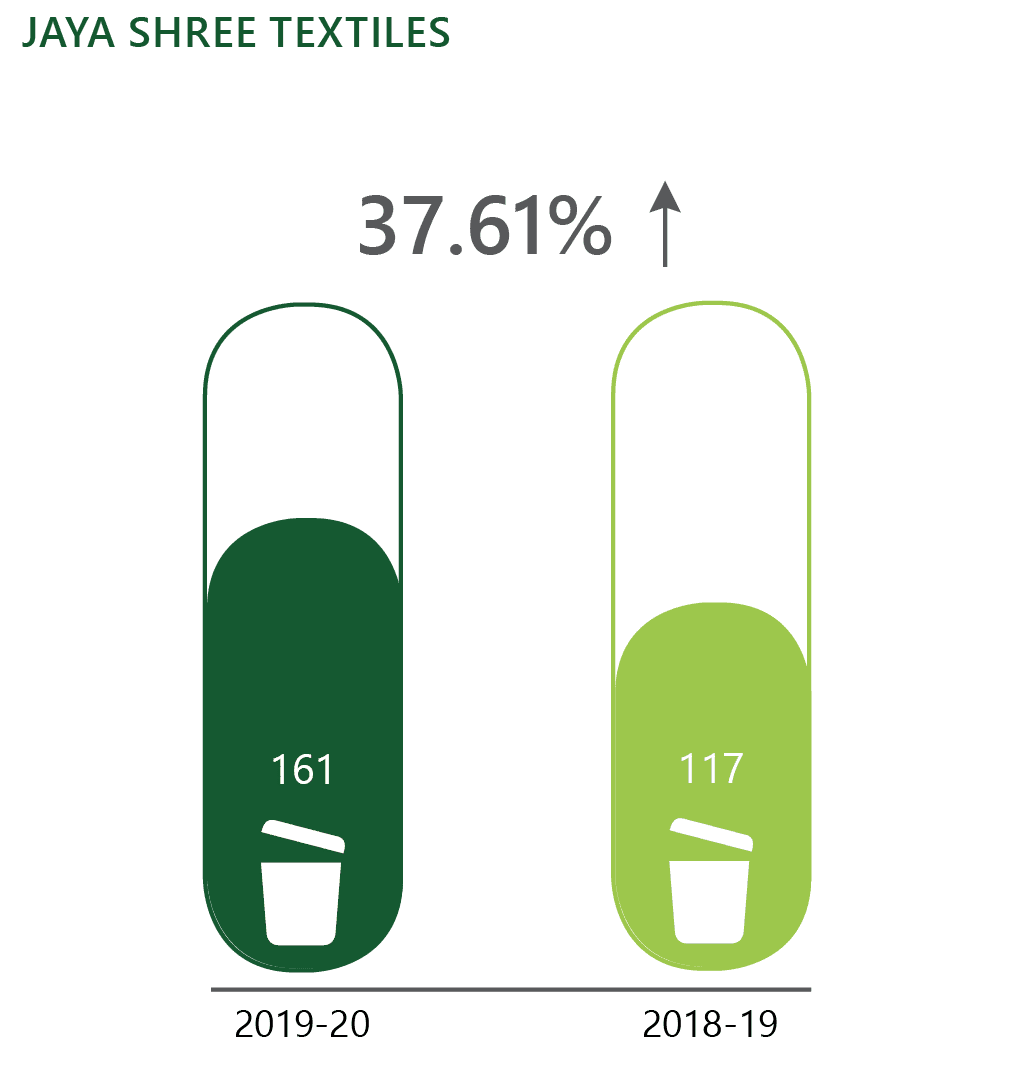
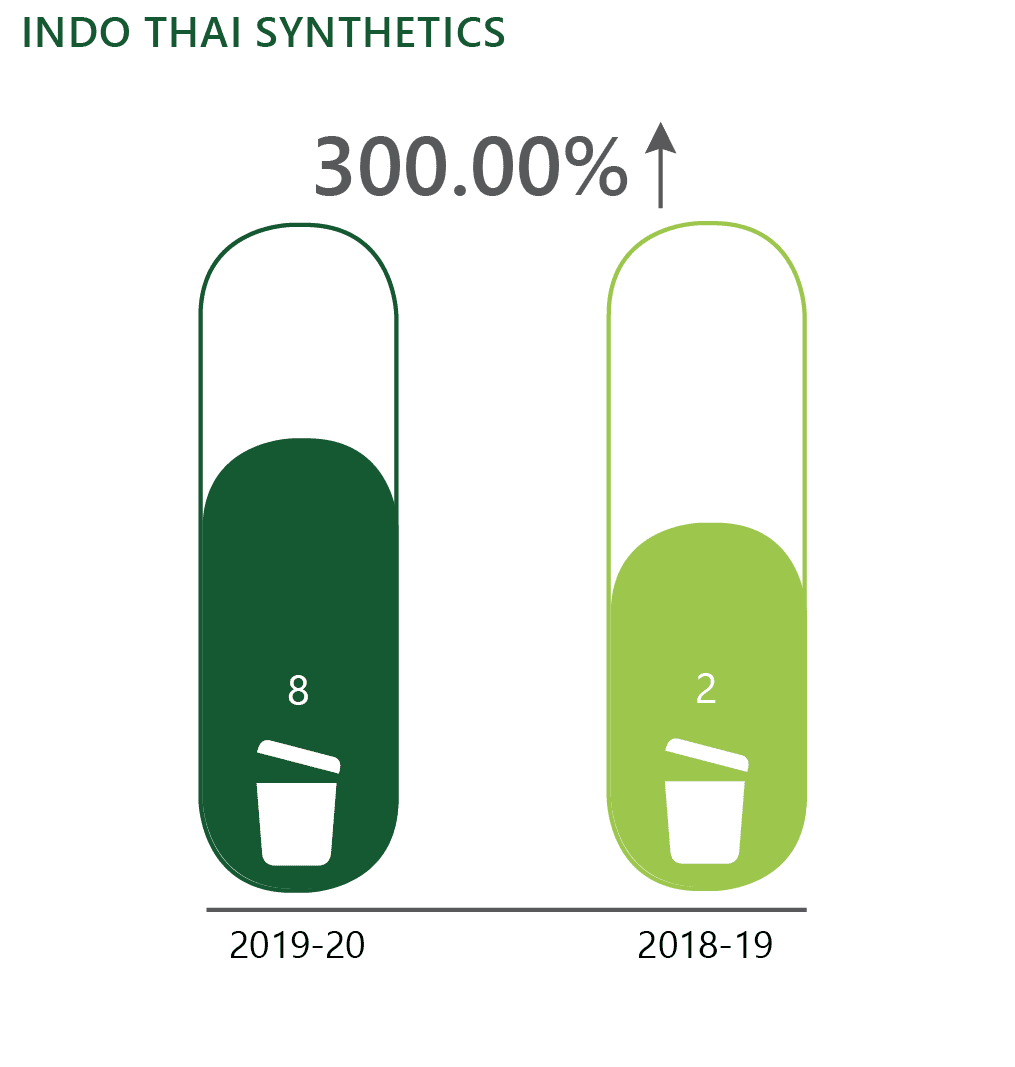
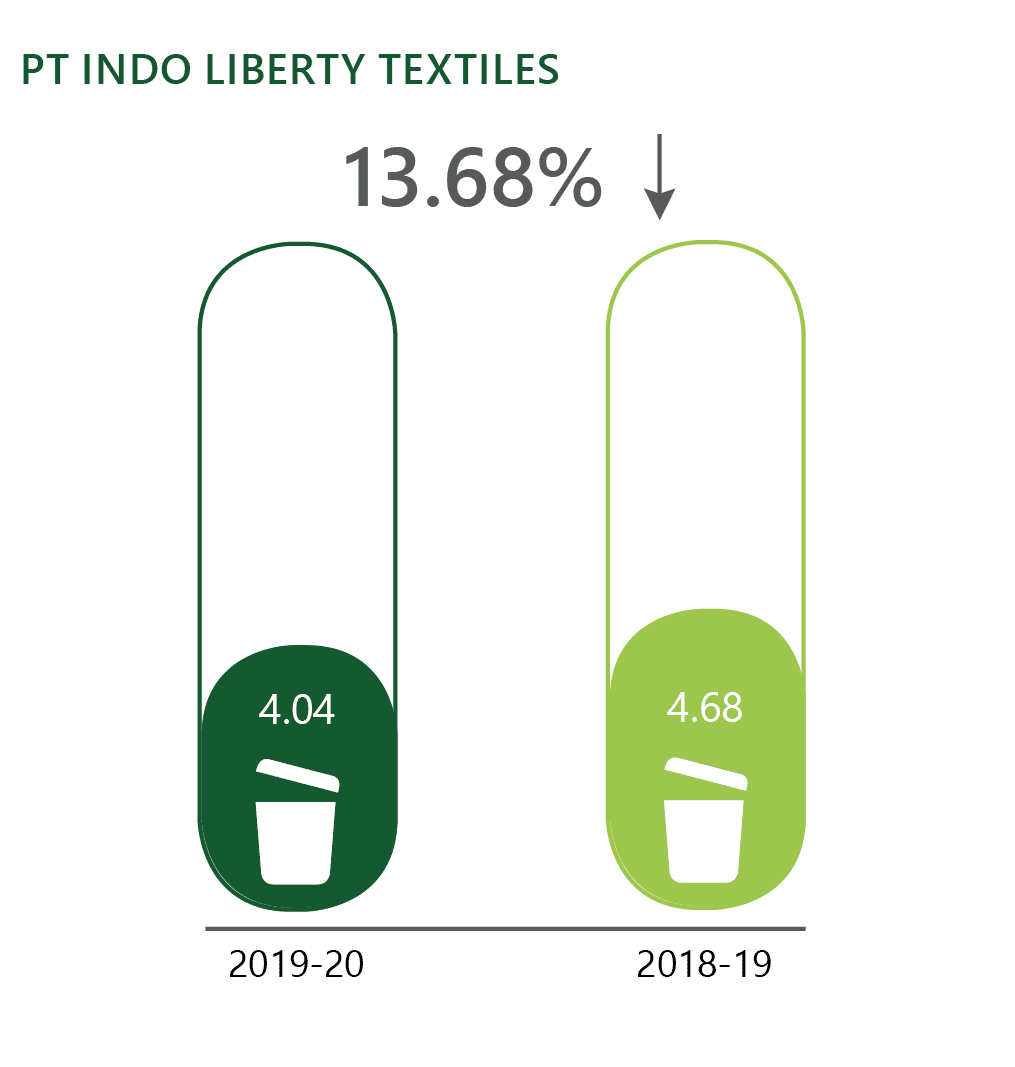
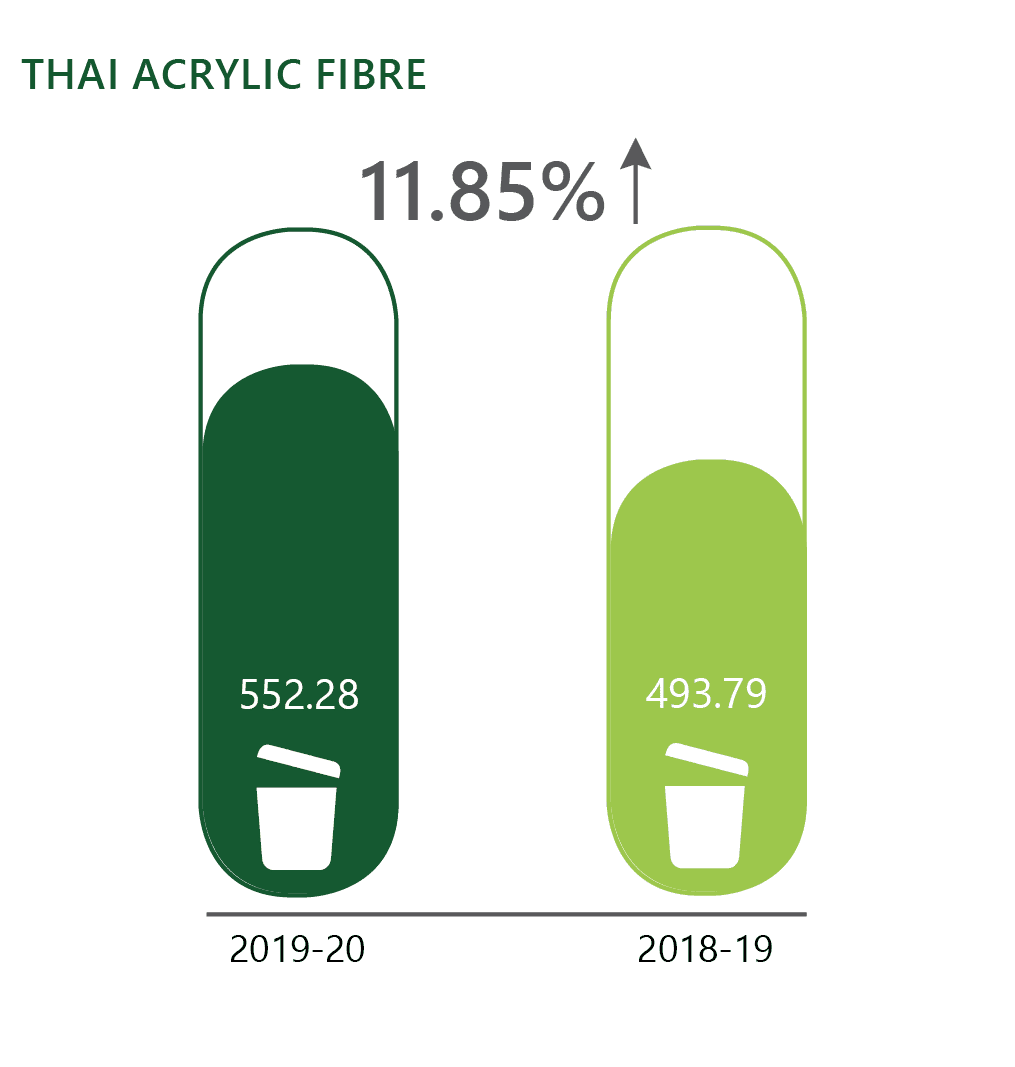
We strive to minimize the generation of hazardous and toxic waste and dispose of such waste scientifically while conforming to regulations and industry-accepted practices.
In 2016-17, we had conducted an IBAT point based study where we identified the Legally Protected Areas; Internationally Recognized Areas and Priority Sites for Biodiversity that are located within 1 km, 10 km and 50 km of the location. We also indicate the potential biodiversity-related features close to the locations.
OS:
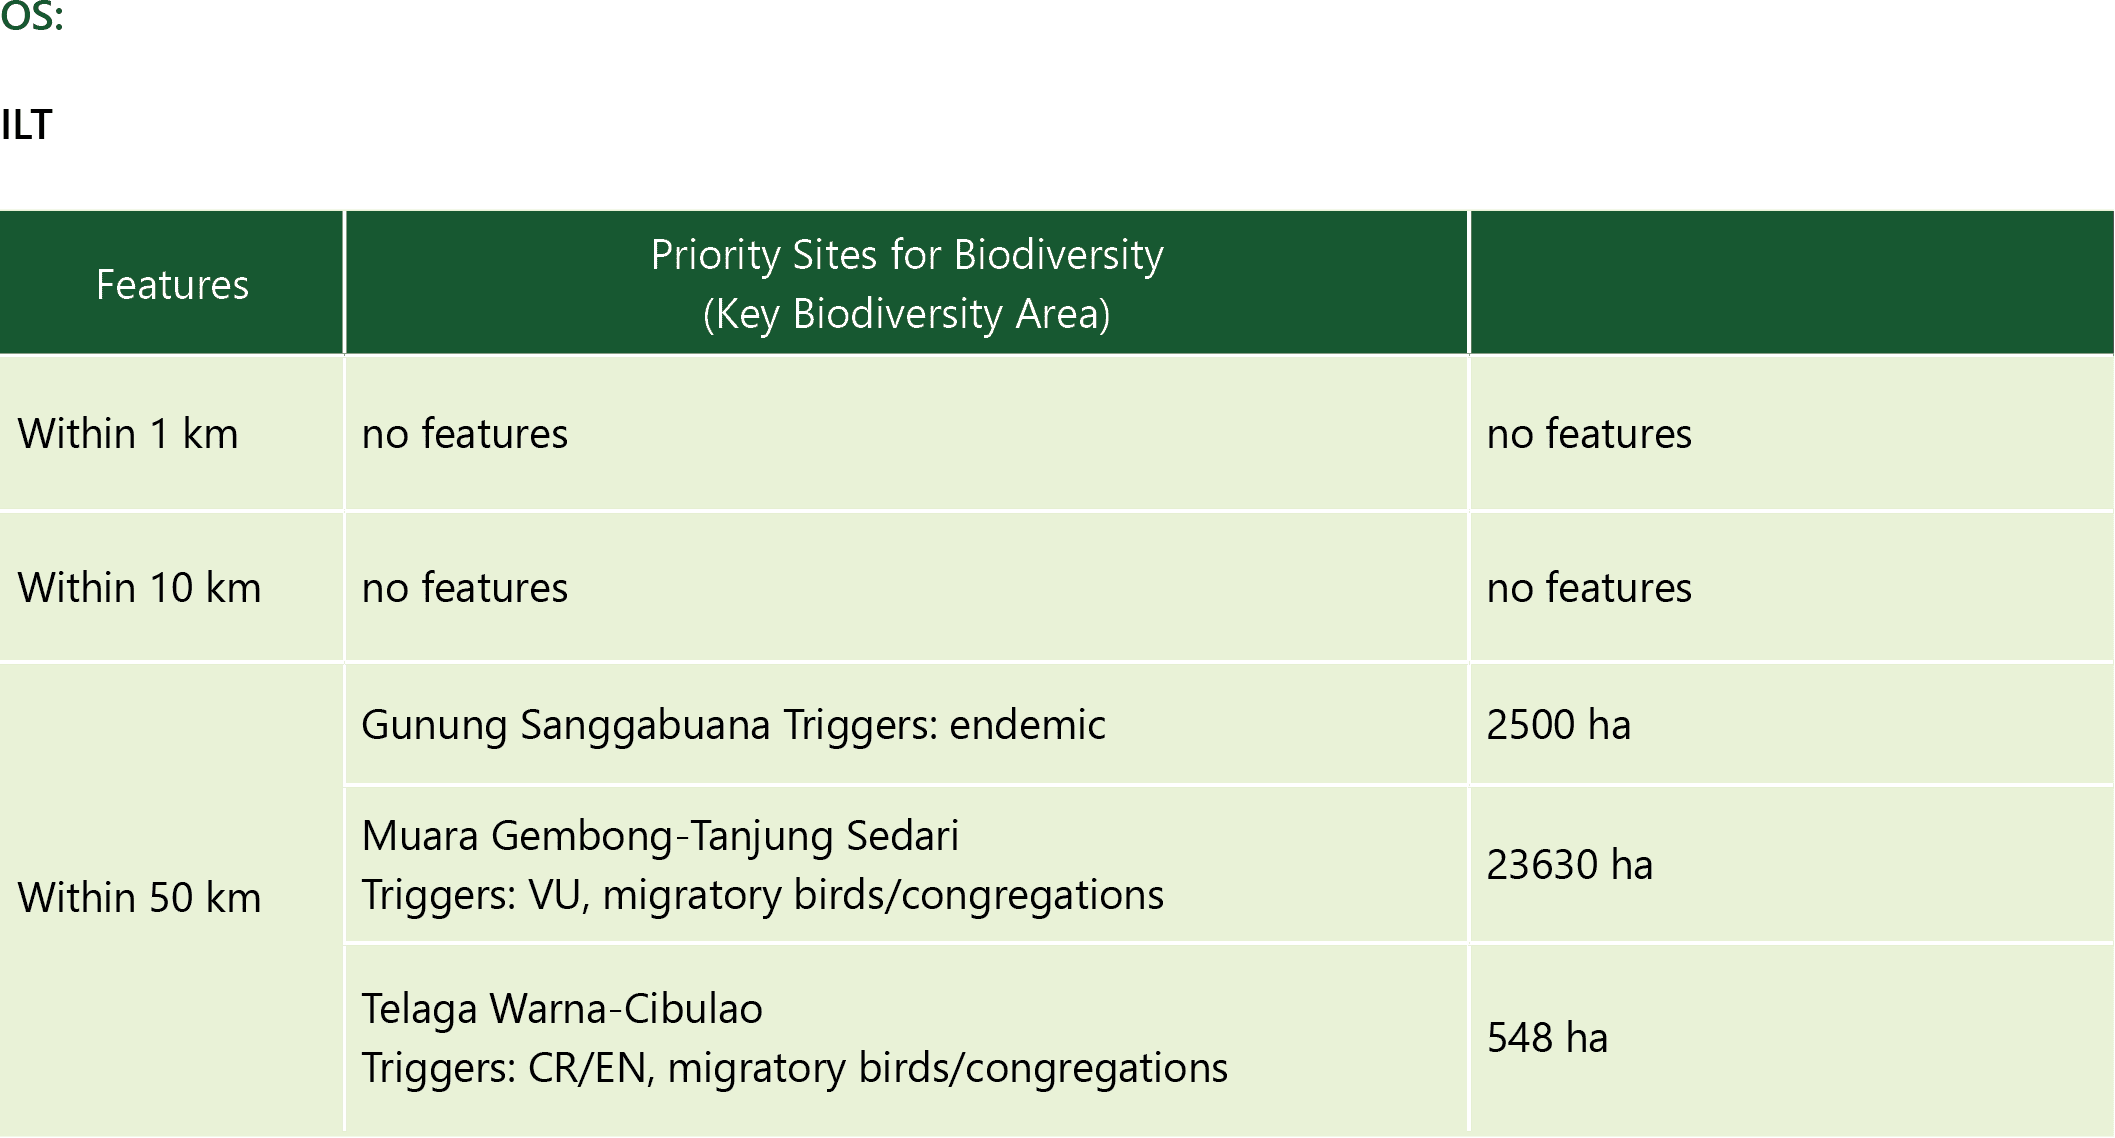
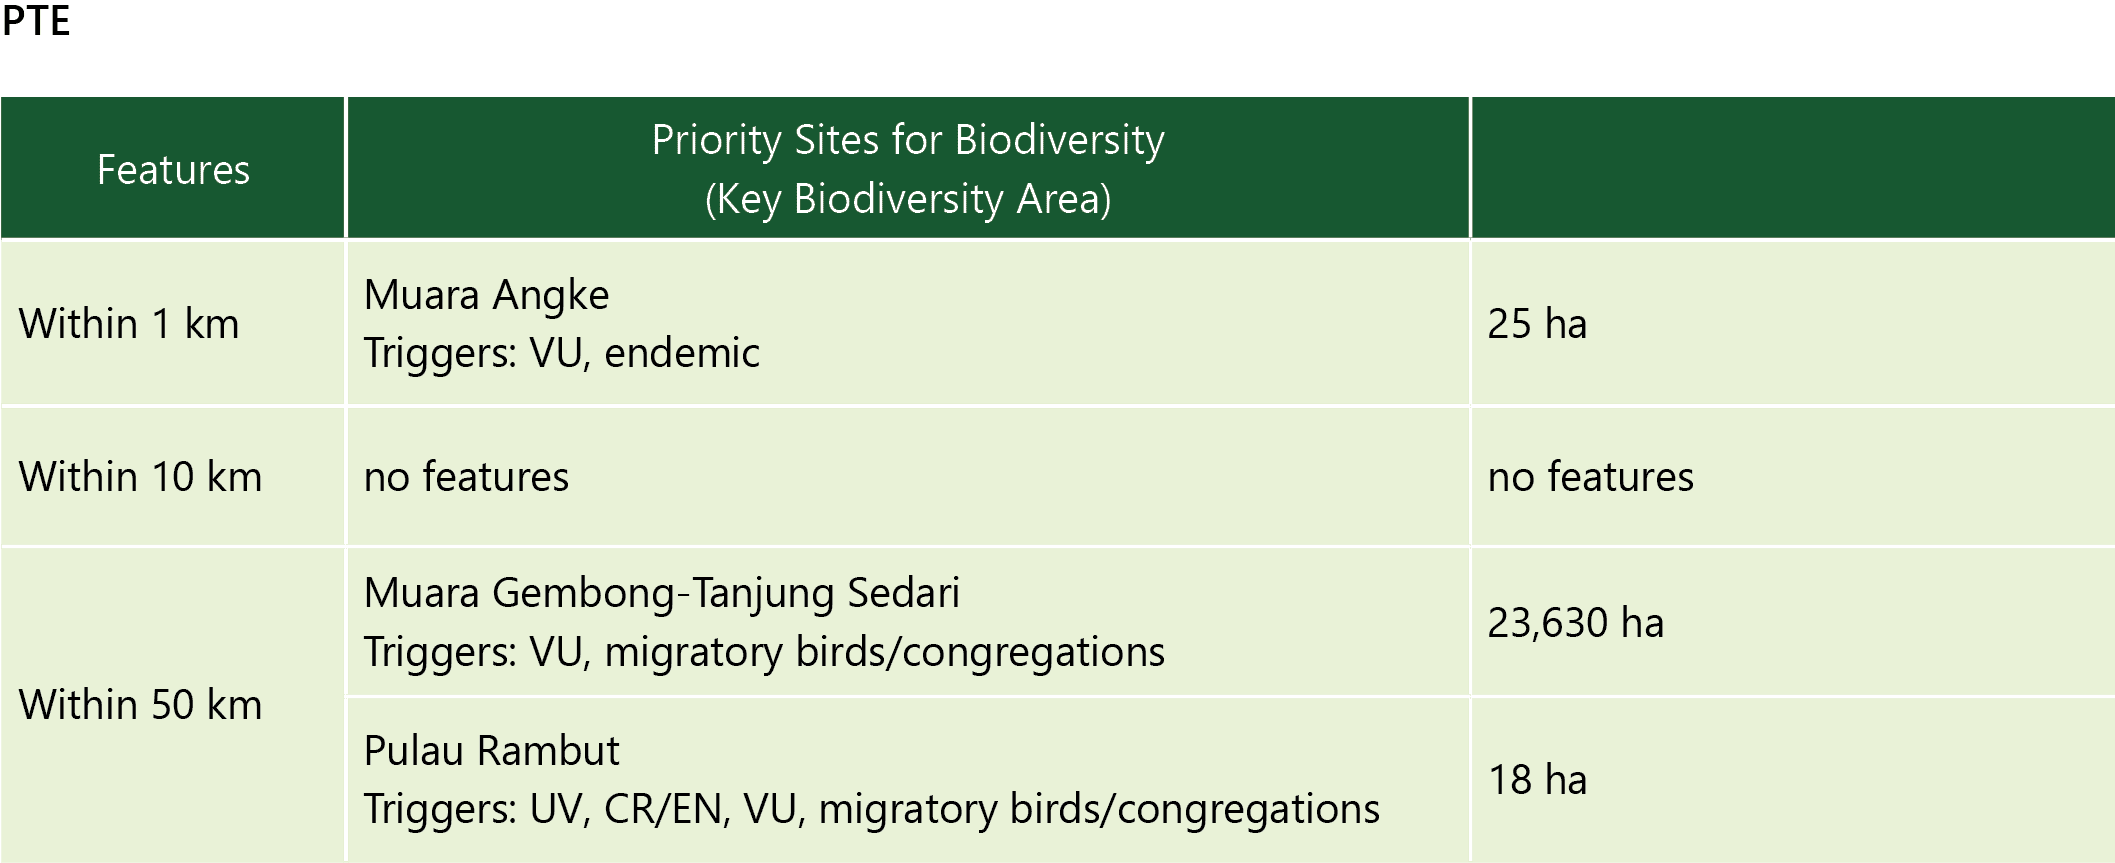
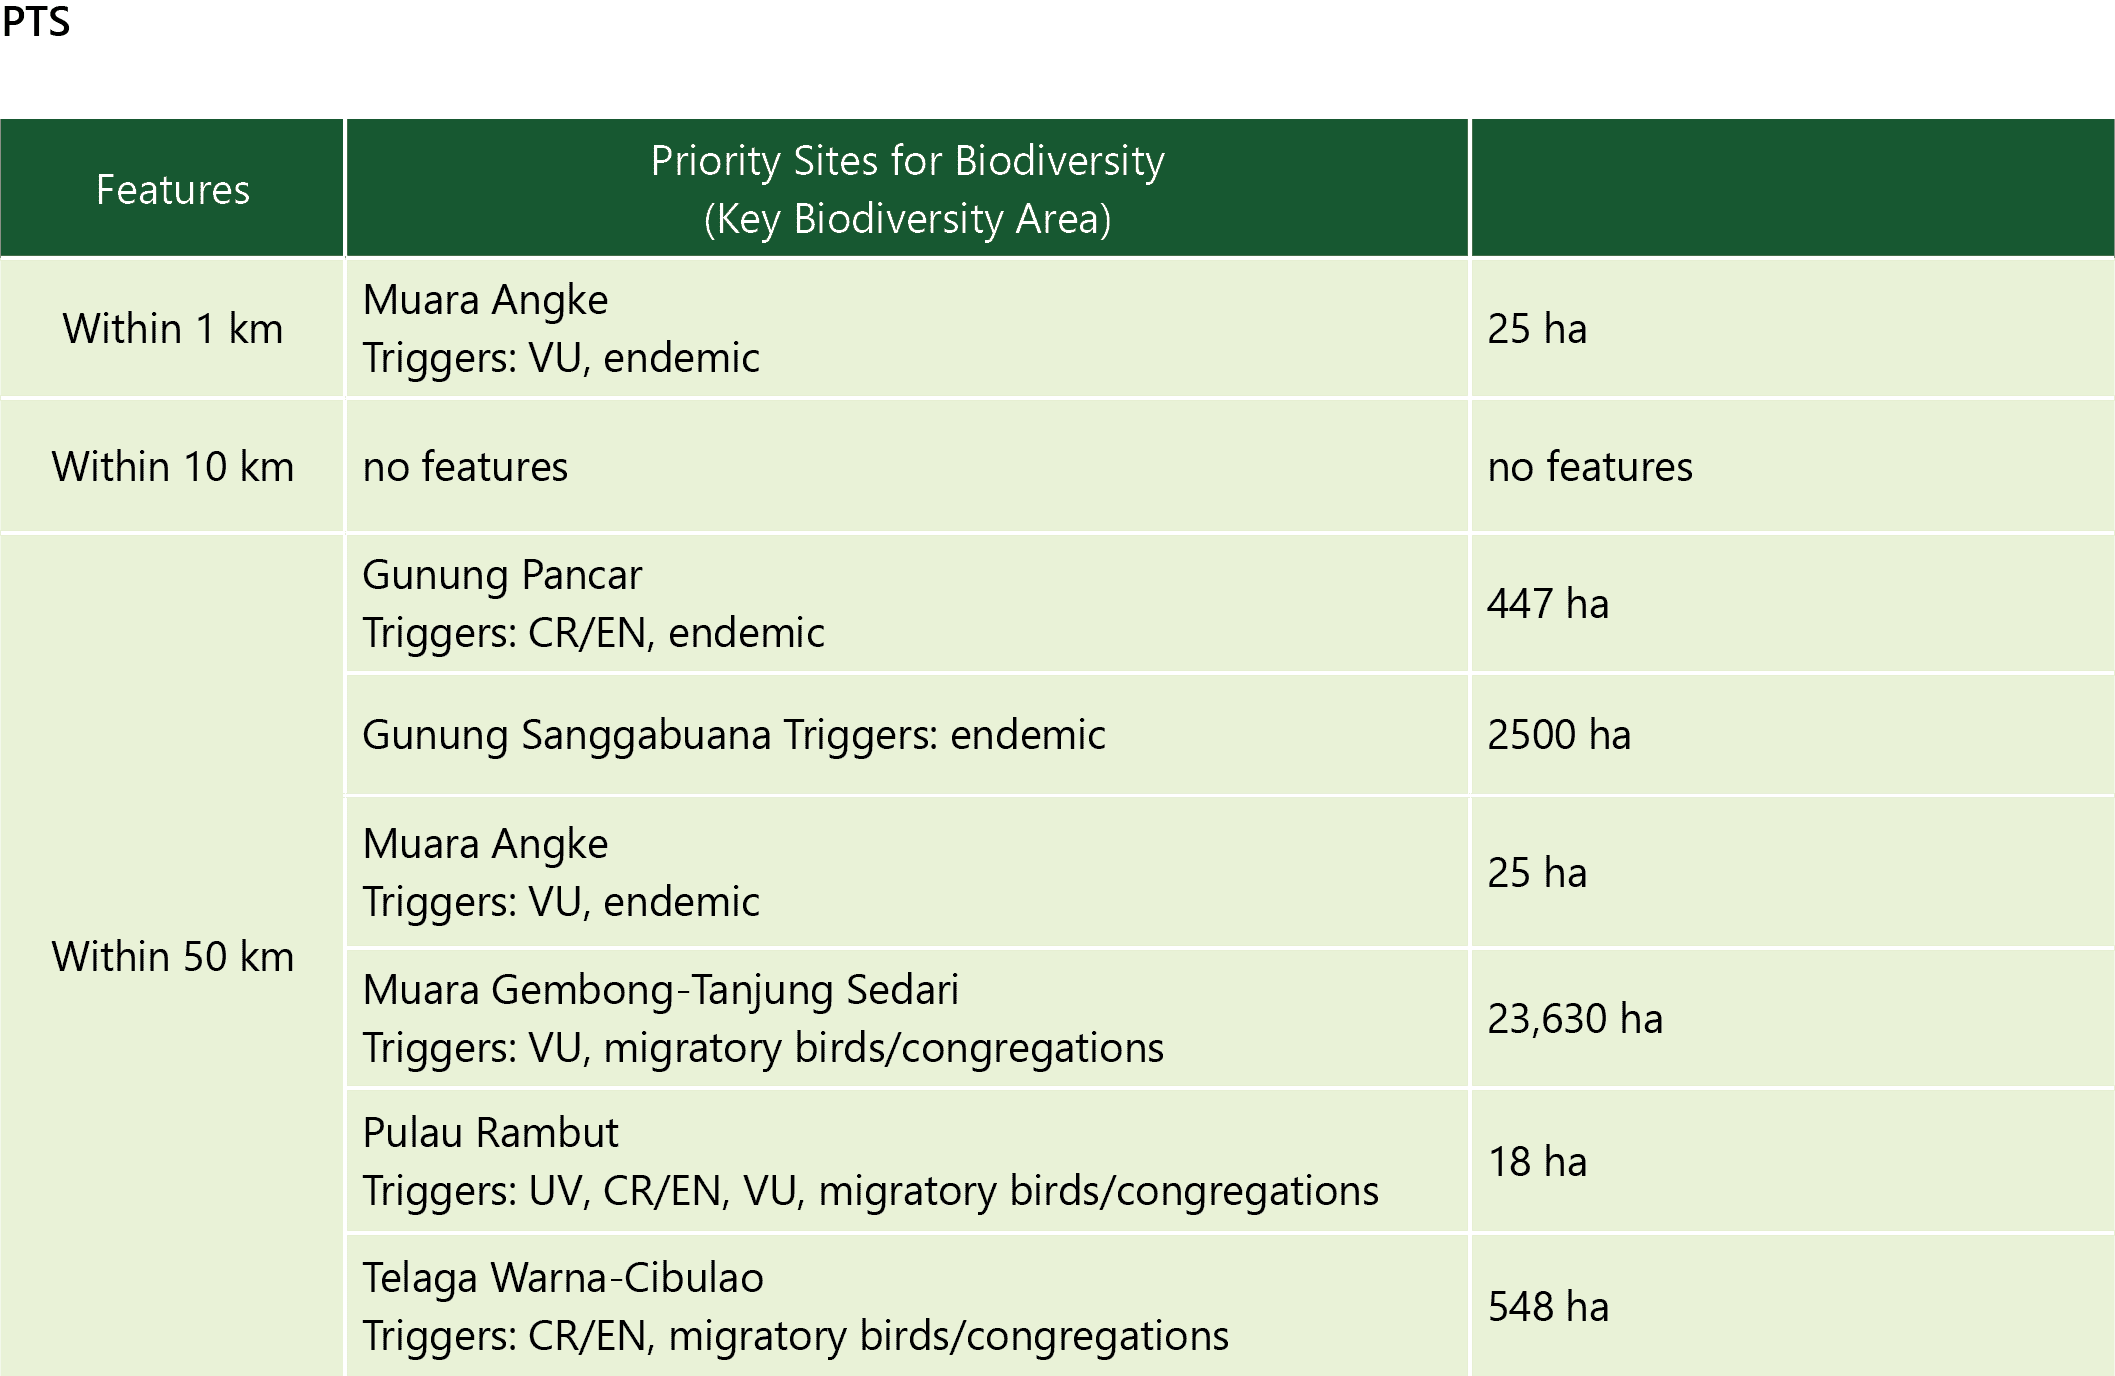
All of our manufacturing units are located away from any biodiversity areas which can get harmed by our operations. We are strategically placed where neither water withdrawal nor any air emission has any direct impact on biodiversity